
Predictive maintenance IoT: calculating the real ROI
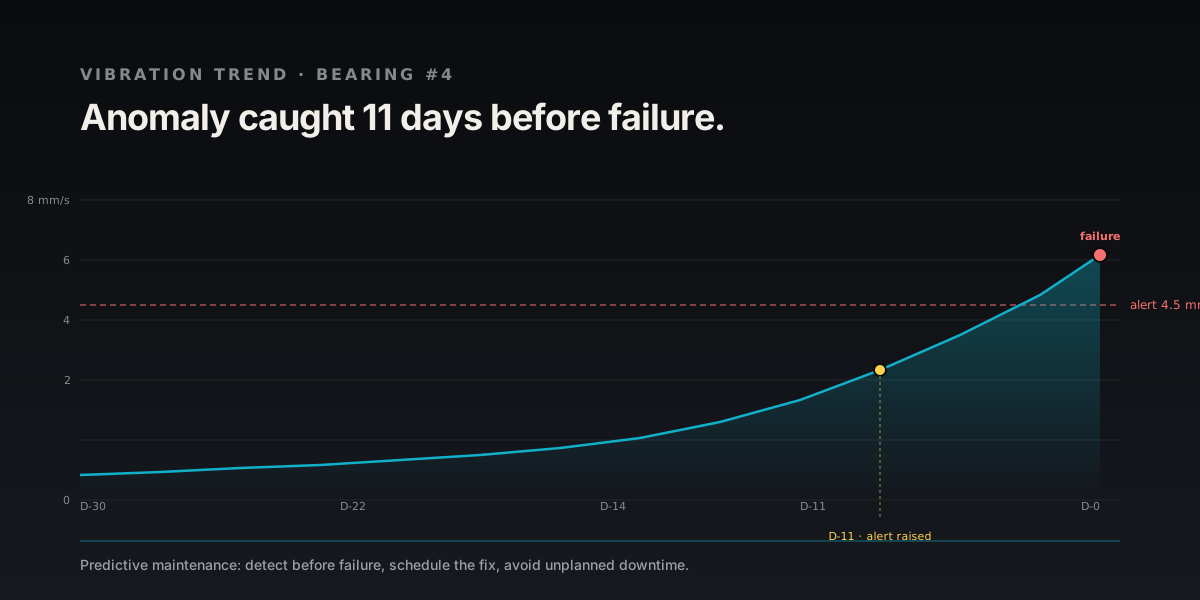
The payback of an IoT predictive maintenance project hinges on one number few teams calculate: the real cost of an hour of downtime. When it is high and documented, the investment can pay back in months; when it is low or unknown, break-even slips to 18 to 24 months. Predictive Maintenance (PdM) instruments a critical machine with vibration, temperature and current sensors to anticipate failure several weeks ahead and make that Return on Investment (RoI) measurable. At AESTECHNO, an electronic design company based in Montpellier, we design sensors compliant with ISO 10816, with a 6-step framework to validate profitability before committing to 3 to 5 years of deployment.
Key takeaways (TL;DR)
IoT predictive maintenance instruments machines with vibration and temperature sensors to anticipate failures. Payback, calculated with a 6-step framework, depends first on downtime cost: a few months in our worked example, 18 to 24 months on many projects. ISO 10816-3 (since replaced by ISO 20816-3) sets the vibration thresholds (4.5 mm/s RMS as the B/C boundary for a medium machine on a flexible support) and LoRaWAN delivers 3 to 5 years of autonomy on an AA cell.
- Vibration thresholds per ISO 10816-3: for a group 2 machine (15 to 300 kW) on a flexible support, 4.5 mm/s RMS marks the B/C boundary and 7.1 mm/s RMS the C/D boundary.
- Payback period: it depends on downtime cost. Our worked example pays back in about 4 months, many projects take 18 to 24. Year 1 delivers 60 to 70% of potential while Machine Learning (ML) models learn and false positives are calibrated.
- Sensor reference: wide-band Micro-Electro-Mechanical Systems (MEMS) accelerometers such as the STMicroelectronics IIS3DWB cover 0 to 6 kHz and capture Ball Pass Frequency Inner-race (BPFI) harmonics weeks before audible failure.
- Radio autonomy: Long Range Wide Area Network (LoRaWAN) delivers 3 to 5 years on an AA primary cell at 1 measurement per minute; Narrowband IoT (NB-IoT) and Long Term Evolution for Machines (LTE-M) trade autonomy for zero-gateway deployment.
- False-positive cost: at 90% false alerts, alert fatigue cancels up to 18% of the gains, which is why a 3 to 6 month calibration phase is non-negotiable.
- Reliability frame: Mean Time Between Failures (MTBF) rises, Mean Time To Repair (MTTR) drops, and Overall Equipment Effectiveness (OEE) targets the reference 85% threshold.
Contents
- Predictive vs reactive vs preventive maintenance: financial impact
- ROI calculation framework: 6 steps to avoid mistakes
- The false-positive trap: alert fatigue
- POC strategy to minimise risk
- Cases from our projects
- Vibration standards and validation tools
- Which radio network for predictive maintenance?
- Data quality: the forgotten prerequisite
- In short
IoT predictive maintenance project? Free 30-min ROI audit
Before committing significant budget, validate technical and financial feasibility with our experts:
- Personalised ROI calculation (your current downtime + maintenance costs)
- Critical machine audit: which to instrument first
- Sensor sizing (vibration, temperature, current)
- Data architecture: edge computing vs cloud
- POC strategy (Proof of Concept): 1 machine, then 10, then 50
Free resource: our electronics specification template
Methodology proven on industrial projects, reply within 48h.
Predictive vs reactive vs preventive maintenance: financial impact
Predictive maintenance is a condition-based strategy that fires an intervention only when measured sensor data crosses a validated threshold, whereas preventive maintenance is a calendar-based strategy and reactive maintenance is a post-failure strategy. Predictive maintenance triggers an intervention based on a measured vibration or thermal signature, unlike preventive maintenance which follows a fixed calendar (2000 h) and reactive maintenance which waits for failure. These three strategies are judged on three standard KPIs: MTBF (Mean Time Between Failures), MTTR (Mean Time To Repair) and OEE (Overall Equipment Effectiveness), whose 85% "world-class" target was proposed by Seiichi Nakajima, the originator of TPM (OEE.com).
The figure below compares the three strategies side by side, and the three subsections that follow detail, in turn, the principle and the typical cost profile of reactive, preventive and predictive maintenance for a critical machine.
1. Reactive (or corrective) maintenance
Principle: repair when it breaks, with no prior monitoring of machine state.
Typical costs for a critical machine:
- Emergency parts: +30 to 50 % vs. normal price (express freight, supplier surcharge)
- Technician intervention: 2 to 5× more expensive (overtime, immediate dispatch)
- Production downtime: 8 to 72 hours (waiting for parts, diagnosis, repair)
- Collateral damage: a broken bearing can destroy the motor shaft (cascading failures)
MTTR impact: typically 4 to 8× the MTTR of a planned preventive intervention, with a direct effect on OEE.
2. Preventive maintenance (fixed planning)
Principle: change parts on a calendar (for example every 2000 h).
Typical costs:
- New parts: premature replacement (the part is often far from end of life)
- Planned downtime: 4 to 8 h of lost production per intervention
- Labour: normal cost (planned intervention)
- Waste: some parts are replaced while they would still have lasted
Advantage: no surprise failures, but a high cost in parts and planned downtime.
3. Predictive maintenance (based on actual condition)
Principle: intervene when sensors detect degradation, typically a vibration RMS above the ISO 10816-3 threshold, a standard now replaced by ISO 20816-3 (for a group 2 machine, 15 to 300 kW, on a flexible support: 4.5 mm/s at the B/C boundary and 7.1 mm/s at the C/D boundary), or a thermal drift greater than 10 °C from the nominal hotspot, measured with typical accuracy of ±1 °C. These groups depend on power, shaft height and mounting type (for electric motors, the IEC separately covers factory vibration tests in IEC 60034-14), which is why a serious programme never uses a single threshold for the whole fleet.
Published orders of magnitude: according to McKinsey (Manufacturing: Analytics unleashes productivity and profitability, 2017), predictive maintenance typically delivers:
- Downtime reduction: -30 to 50 %
- Machine lifetime increase: +20 to 40 %
But beware: these numbers are favourable orders of magnitude. Reality depends on your context (machine types, data quality, organisational maturity).
ROI calculation framework: 6 steps to avoid mistakes
A Return on Investment (RoI) framework is a sequenced calculation that ties each technical choice to a monetary baseline, so a predictive-maintenance project is evaluated against real downtime cost rather than vendor marketing.
The framework runs in six steps. Step 1 measures the real cost of current failures from the last 12 to 24 months of history, including indirect costs. Step 2 applies the Pareto principle to isolate the critical machines. Step 3 sizes the sensors without over-instrumenting. Step 4 adds up full costs, both initial CAPEX and recurring OPEX. Step 5 estimates realistic gains with a conservative scenario, counting only 60-70 % of them in year one. Step 6 derives the ROI and the payback period. The P-F curve below shows why the predictive window exists in the first place.
Step 1: Calculate the real cost of your current failures
Don't trust your intuition. Analyse your last 12-24 months with this formula:
Annual failure cost = (Number of failures × Average downtime × Hourly production cost) + Emergency repair costs
Example: 50-machine workshop:
- Failures/year: 18 critical failures
- Average downtime: 16 hours
- Hourly cost of lost production: 4,500 €/h (hourly revenue minus variable costs)
- Emergency repair costs: 280,000 €/year
Total = (18 × 16 × 4,500) + 280,000 = 1,296,000 + 280,000 = 1,576,000 €/year
Common mistake: forgetting indirect costs (customer delays, contractual penalties, brand damage).
Step 2: Identify critical machines (Pareto principle)
The Pareto principle usually applies: a minority of machines causes most of the downtime. Focus on them first.
Criticality criteria:
- Bottleneck: if this machine stops, the whole line stops
- Repair time: >8h (rare parts, specialised skills)
- Failure history: >3 failures/year costing >20k€ each
- Equipment age: >10 years (accelerated degradation)
Result: on 50 machines, you identify 8-12 critical machines to instrument first.
Step 3: Size the sensors (avoid over-instrumentation)
Not every sensor is needed on every machine. Here is the minimum viable set:
| Machine type | Essential sensors | Unit cost |
|---|---|---|
| Rotating motors | Vibration (3-axis) + temperature | 800-1,200 € |
| Pumps | Vibration + pressure + flow | 1,200-1,800 € |
| Compressors | Vibration + temperature + motor current | 1,500-2,200 € |
| Conveyors | Vibration (single-axis) + temperature | 600-900 € |
| Transformers | Temperature (multi-point) + dissolved gas | 2,000-3,500 € |
For 10 critical machines (typical mix): sensor budget = 12,000 - 18,000 €
In sectors exposed to physical risks (steel, chemicals, construction), predictive maintenance also extends to operator monitoring: wearable devices integrating biometric sensors (heart rate, body temperature, fall-detection accelerometer) help prevent accidents linked to fatigue or thermal stress, complementing machine monitoring.
Step 4: Calculate full costs (infrastructure + platform + integration)
Initial costs (CAPEX):
- Sensors: 12,000 - 18,000 € (10 machines)
- IoT gateways: 3,000 - 6,000 € (2-4 gateways depending on surface area)
- Analytics platform: 15,000 - 50,000 € (licence + configuration)
- Installation + cabling: 8,000 - 15,000 €
- Team training: 5,000 - 10,000 €
- CMMS integration: 10,000 - 25,000 € (if connecting ERP/CMMS)
Total CAPEX: 53,000 - 124,000 € for 10 machines
Recurring costs (annual OPEX):
- Cloud platform subscription: 8,000 - 20,000 €/year
- Connectivity: 1,200 - 3,000 €/year (cellular or private LoRaWAN)
- Technical support: 5,000 - 12,000 €/year
- Sensor maintenance: 2,000 - 4,000 €/year (recalibration, replacement)
Total OPEX: 16,200 - 39,000 €/year
For systems deployed in areas without cellular coverage or that need maximum autonomy, the radio protocol choice directly impacts OPEX. Our article on NB-IoT, LTE-M and satellite connectivity details the options for keeping data flowing in isolated environments, including satellite solutions for remote industrial sites.
Step 5: Estimate realistic gains (not marketing promises)
Conservative scenario (prudent for ROI validation):
- Downtime reduction: -25% (not -50%) → 324,000 €/year savings
- Emergency repairs reduction: -20% → 56,000 €/year savings
- Spare parts stock optimisation: -10% → 15,000 €/year savings
Total conservative annual gains: 395,000 €/year
Note: in year one, count only 60-70 % of these gains (algorithm learning time, threshold adjustments).
Step 6: Calculate ROI and payback period
Year 1:
- Initial investment: -90,000 € (average CAPEX)
- OPEX: -25,000 €
- Gains (70% of potential): +276,500 €
- Net result: +161,500 €
Year 1 ROI = (161,500 / 90,000) × 100 = 179%
Payback period = 90,000 / (276,500 - 25,000) ≈ 0.36 year, or about 4.3 months
Years 2-5:
- Annual OPEX: -25,000 €
- Gains (100% of potential): +395,000 €
- Net benefit/year: +370,000 €
Cumulative 5-year ROI = (161,500 + 4×370,000) / 90,000 ≈ 1,824%
Why this case is fast: the example assumes downtime valued at 4,500 € per hour, 18 critical failures a year and a clean failure history. That is the favourable case. With a lower downtime cost, historical data to rebuild, or alert calibration that drags on, break-even moves out sharply: in our practice, many projects take 18 to 24 months. Rerun this calculation with your own numbers before committing the budget.
The false-positive trap: the hidden cost of alert fatigue
Alert fatigue is the operational state in which a monitoring system produces so many false positives that technicians ignore real warnings, and it is the single most under-estimated cost of predictive-maintenance deployments. A major issue rarely mentioned: false alerts.
False positives cost money because every alert, valid or not, consumes technician investigation time. In the scenario below, nine alerts out of ten turn out to be false, which adds up to a yearly loss large enough to cancel 18 % of the projected gains. The remedy combines a learning phase of 3 to 6 months to refine thresholds, adaptive Machine Learning, alert prioritisation and visual dashboards.
Real scenario: your system generates 150 alerts/month. After investigation:
- 15 valid alerts (10 %): justified intervention
- 135 false-positive alerts (90 %): wasted technician time
Cost of false positives:
- Investigation time: 135 × 1 h = 135 h/month
- Technician hourly cost: 45 €/h
- Monthly loss: 6,075 € = 72,900 €/year
This cost cancels 18 % of your gains if not controlled.
Solutions:
- Learning phase: 3-6 months to refine alert thresholds
- Adaptive Machine Learning: algorithms that learn each machine's normal behaviour
- Alert prioritisation: low/medium/high criticality (don't disturb for everything)
- Visual dashboards: technicians see the trend before the alert fires
POC (Proof of Concept) strategy: minimise risk
A Proof of Concept (POC) is a bounded pilot deployment on one or two machines that validates the full sensor-to-dashboard chain before any fleet-wide rollout. Never deploy on 50 machines at once. Use a progressive approach:
The progressive approach runs in three phases. Phase 1 instruments the single most problematic machine for 2 to 3 months, with at least vibration and temperature sensors, and succeeds if one failure is avoided with savings above the POC cost. Phase 2 extends to the 10 critical machines identified in Step 2 over 6 months, with CMMS/ERP integration and team training. Phase 3 scales to the rest of the fleet over 12 to 18 months, only if Phase 2 succeeded.
Phase 1: POC on 1 machine (2-3 months)
- Pick THE most problematic machine (with documented failure history)
- Install vibration + temperature sensors as a minimum
- Test the platform with one user (maintenance manager)
- Goal: validate that the system detects real anomalies
Success criterion: at least 1 failure avoided with 3 months of savings > POC cost.
Phase 2: deploy on 10 critical machines (6 months) - Budget 50-80k€
- Instrument the 10 machines identified in Step 2
- CMMS/ERP integration
- Wider maintenance team training
- Goal: positive ROI from 8-12 months
Phase 3: scale to 50+ machines (12-18 months) - Budget 150-300k€
- Extension to the rest of the fleet if Phase 2 succeeded
- Continuous algorithm optimisation
- Goal: cumulative gains >1M€ over 3 years
Our sensor and connectivity expertise for predictive maintenance
AESTECHNO's predictive-maintenance expertise spans the whole chain under one team: high-frequency vibration sensing, battery and BMS design for multi-year autonomy, a full wireless portfolio, a high-availability data layer and firmware CI/CD for deployed fleets. The sensor comes first, because every later link depends on the signature it captures.
High-frequency, low-power vibration sensor: on a recent project, we deployed the STMicroelectronics IIS3DWB, a 3-axis accelerometer combining wide bandwidth (flat response up to 6 kHz) and a contained operating current (1.1 mA in active mode). The part, per the STMicroelectronics datasheet (ST product page), has a noise density of 75 µg/√Hz, which is what lets it surface Ball Pass Frequency Inner-race harmonics that cheaper MEMS parts flatten. This "high-frequency + low-power" combination is decisive in vibration monitoring: it lets us extract usable signatures from bearings and gears while keeping multi-year battery life. Wide-band acceleration beyond 5 kHz is where incipient bearing defects surface weeks before audible symptoms.
Battery, wireless, data layer and firmware: the rest of the chain
Battery and BMS, autonomy of remote sensors: a sensor installed on a distant motor only has value if it transmits for the full duration of a maintenance contract. At AESTECHNO we have shipped a broad portfolio of products integrating batteries and BMS (Battery Management System): protection, cell balancing, fuel gauge, RF current-peak management. This expertise determines whether real-world autonomy holds up over 5 to 10 years.
Full wireless portfolio: our portfolio covers every wireless technology deployed in customer projects. We ship Bluetooth (Classic, BLE, 5.4 PAwR), Wi-Fi, LoRa/LoRaWAN, RFID, 5G and LTE-M. Site architecture drives the choice. Dense indoor favours Bluetooth or Wi-Fi. Kilometre-scale outdoor favours LoRaWAN or cellular. Mobility favours LTE-M. We design dual-mode sensors when a single radio cannot cover the use case.
Data layer, top-tier HA cluster: we have designed and deployed a top-tier HA database cluster dedicated to massive IoT ingestion. A data gap equals an ML model blind exactly when a failure signature emerges. In our practice, what kills a project is not write latency. It is what happens when a node falls over at 3 a.m. with 50,000 sensors emitting. Multi-node replication, automatic failover and retention guarantee the continuity of the analytical flow.
Firmware CI/CD for deployed fleets: on several customer projects, we have built auto-deployment pipelines gated by tests to continuously push firmware updates to sensors in production. Principle: the pipeline is the only path to production. Each OTA binary pushed to field devices is signed, versioned and traceable to an auditable commit, essential when the fleet grows and algorithmic fixes must reach the field without regressions.
End-to-end IoT, rare on the market: end-to-end coverage under a single team is uncommon. The chain includes sensor hardware, firmware, connectivity, CI/CD and HA database. Reliable predictive maintenance requires every link to hold. An accurate sensor. A stable radio link. A data point that arrives. A data point that stays. A model that can be updated.
Cases from our projects
Two cases from our projects show where a predictive-maintenance architecture creates value in the field: synchronising a fleet of about a hundred wireless sensors with Bluetooth 5.4 PAwR, and keeping a high-availability database cluster ingesting when a node fails in the middle of the night. Both cases serve the same goal: never lose a failure signature.
Figure 4 shows what such a signature looks like on a degrading bearing. The 1x peak reveals unbalance, FTF points to the cage, BPFO and BPFI to the races and BSF to the ball. A sensor with a wide bandwidth, such as the 6 kHz MEMS part described above, surfaces BPFI weeks before the failure becomes audible.
The following cases are concrete observations from recent client project work, where each situation illustrates a specific lever that separates a textbook architecture from one that actually performs in the field. Two situations from real projects illustrate where a predictive-maintenance architecture really creates value:
- Case 1: fleet synchronisation in Bluetooth 5.4 PAwR. On a customer wireless-sensor project, we developed a custom protocol on a Nordic module using Periodic Advertising with Responses (PAwR), a Bluetooth SIG feature of Bluetooth Low Energy (BLE) 5.4: about a hundred devices synchronised with sub-5 µs sync, no collisions, and no Wi-Fi infrastructure. Nordic Semiconductor supports PAwR on its current Bluetooth parts (see the nRF54L15 product page), and the tight synchronisation is exactly what synchronous vibration capture across a large fleet needs. Unlike LoRaWAN or cellular, PAwR delivers a controlled topology with bounded latency.
- Case 2: data flow holding up at 3 a.m. We deployed a top-tier HA database cluster for continuous sensor ingestion. Unlike marketing demos that highlight write latency, the real test is what happens when a node falls over at 3 a.m. with 50,000 sensors emitting. Multi-node replication, automatic failover and long retention guarantee that no failure signature is lost when it counts.
Which radio network for predictive maintenance?
The radio network is the wireless link that carries sensor data from the machine to the analytics platform. Its choice directly drives sensor autonomy and project Operational Expenditure (OPEX). Published Low Power Wide Area Network (LPWAN) comparisons, including surveys in IEEE Communications Magazine, reach the same conclusion: no single radio wins on all three axes of range, throughput and power, which is why we arbitrate systematically between three families based on site density, gateway distance, and useful throughput.
In practice, LoRaWAN suits slow readings over large sites, NB-IoT / LTE-M suits sites where no gateway can be installed, and Wi-Fi 6 or Bluetooth 5.4 PAwR suits wide-band vibration capture that needs throughput. The three families compare as follows:
- LoRaWAN: 2 to 5 km urban range, 10 to 15 km rural, 0.3 to 50 kbps throughput, typical sensor autonomy 3 to 5 years at one measurement/min on an AA cell. Ideal for slow readings (temperature, counting, aggregated vibration RMS) and large sites without cellular coverage. Details in our article LoRaWAN vs NB-IoT vs Sigfox.
- NB-IoT / LTE-M: cellular-operator coverage, 1.6 to 10 s latency, 20 to 250 kbps throughput, shorter autonomy than LoRaWAN but zero infrastructure to deploy. Application-layer protocols on top are typically MQTT or CoAP, both standardised and broker-friendly. Preferred when no gateway can be installed.
- Wi-Fi 6 / Bluetooth 5.4 PAwR: ≥ 1 Mbps throughput, < 10 ms latency; Wi-Fi 6 draws more power and needs wired power or a generous battery, while PAwR remains a low-power option. We use it when monitoring requires uncompressed wide-band vibration signature capture (≥ 6 kHz).
MEMS vs piezoelectric comparison for the vibration chain: a modern MEMS accelerometer (such as the ST IIS3DWB) offers up to 6 kHz of flat band, consumption around 1 mA (1.1 mA), and a much lower cost; industrial piezoelectric sensors reach beyond 20 kHz and tolerate temperatures up to 150 °C, but require an IEPE conditioner and wired power. For most medium-power industrial rotating machines covered by ISO 10816, wide-band MEMS is sufficient and radically simplifies wireless integration.
Vibration standards and validation tools
Vibration standards are the public reference grids that define when a rotating machine is "good", "acceptable" or "unacceptable" based on measured RMS velocity. Published by the International Organization for Standardization (ISO), these documents turn a raw sensor reading into an actionable maintenance decision. A serious industrial predictive-maintenance project relies on this recognised framework, not on improvised thresholds.
The four ISO documents below cover the chain from vibration severity evaluation (ISO 10816, now the ISO 20816 series) to monitoring-system architecture (ISO 13374), programme setup (ISO 17359) and diagnosis (ISO 13379). Our lab tooling then checks the other side of the equation: that the wireless sensors measuring against these grids do not need replacing more often than the bearings they monitor. The reference documents are:
- ISO 10816 (mechanical vibration, evaluation by measurement on non-rotating parts): defines vibration severity classes by machine power and type (since replaced by the ISO 20816 series)
- ISO 13374 (condition monitoring and diagnostics): functional architecture of condition monitoring systems
- ISO 17359: general guidelines for setting up a monitoring programme
- ISO 13379: data interpretation and diagnosis
For tooling, we use the Nordic PPK2 and the Keithley DMM7510 in our lab to finely characterise wireless sensor consumption. A predictive-maintenance RoI collapses if sensors must be replaced more often than the bearings they monitor. Nanopower regulators such as the Texas Instruments TPS62840 specify a typical quiescent current of 60 nA in their datasheet (TI TPS62840 resources), which is what keeps the sensor budget honest at the microamp level.
The "6-month RoI" of vendor brochures is not the rule: payback depends first on downtime cost. Our worked example, at 4,500 € per hour of downtime, pays back in a few months; on many projects the real RoI only emerges after 18 to 24 months. ML models need time to accumulate history. False positives take 3 to 6 months to calibrate. Field teams need weeks to fold alerts into their rounds. On those projects, the curve really inverts in years 2 and 3, not in the first twelve months.
Data quality: the often-forgotten prerequisite
Data quality is the precondition on which every Machine Learning (ML) model is built, and a predictive-maintenance algorithm is only as trustworthy as the historical dataset that trains it. ML algorithms need clean historical data.
Clean history means a failure log, an up-to-date maintenance log and machine operating parameters, the three items listed below. When that history is missing or incomplete, the project needs an extra data-collection phase of 3 to 6 months before AI becomes effective, a budget line to digitise existing records, and simple fixed-threshold rules as a starting point before advanced ML. This prerequisite is also why our worked example counts only 60-70 % of the gains in year one.
Minimum required data:
- 6-12 months of failure history: dates, causes, parts changed, downtime
- Up-to-date maintenance log: preventive interventions performed
- Machine parameters: rotation speed, load, normal temperature
If your data is missing or incomplete:
- Add 3 to 6 months of data collection before AI is effective
- Plan budget to digitise and structure existing data
- Start with simple rules (fixed thresholds) before advanced ML
In short: what separates a profitable project from a failed one
A profitable predictive-maintenance project is one where sensor choice, radio sizing and data continuity all hold at once. An IoT predictive maintenance project becomes profitable when three disciplines hold simultaneously: a fit-for-purpose sensor (wide-band MEMS for most medium-power rotating machines, IEPE piezo above), a properly sized radio (LoRaWAN for 2 to 15 km with 3 to 5 years autonomy; NB-IoT/LTE-M cellular without a gateway; Bluetooth 5.4 PAwR for wide-band signatures), and a continuous data layer (HA cluster, replication, backfill).
Payback depends first on downtime cost: a few months when an hour of downtime is worth thousands of euros, as in our example, 18 to 24 months on many projects, with the first year at 60-70 % of potential while ML models learn and false positives are calibrated.
How AESTECHNO covers the full chain
At AESTECHNO, an electronic design firm based in Montpellier, we design the full chain: ISO 10816-compliant MEMS/piezo sensor, low-power RTOS firmware, BMS for multi-year autonomy, HA backend so no failure signature is lost. This full-stack coverage under a single engineering team is rare on the market, and it is precisely what avoids the three classic failures: a poorly placed sensor, a saturated radio link, a data point lost just as a failure signature emerges.
FAQ: predictive maintenance IoT and ROI
What is the difference between predictive maintenance and condition monitoring?
Condition monitoring is one component of this approach. It collects sensor data continuously (vibration, temperature), while the predictive layer adds intelligence (AI, ML) to predict when a failure will happen (in 2 weeks, 1 month). AESTECHNO integrates both: real-time monitoring + algorithms tuned to your machines.
How long does it take for AI algorithms to become reliable?
Count 3-6 months minimum of data collection so Machine Learning learns each machine's normal patterns. For complex equipment (turbines, high-pressure compressors), allow 12 months. During that period, use fixed thresholds validated by your maintenance experts. Our electronic design company in Montpellier combines domain expertise and AI to accelerate the ramp-up.
Can predictive maintenance work without cloud (edge computing only)?
Yes, with an edge computing architecture where processing happens locally on industrial gateways. Pros: no internet dependency, ultra-low latency (<100 ms), guaranteed data confidentiality. Cons: +20-30 % initial cost (more powerful edge hardware), less flexibility to adjust models. We recommend an edge + cloud mix: real-time processing local, long-term storage and AI re-training in the cloud.
What are the main organisational obstacles to deployment?
From our field experience: (1) resistance from senior technicians who fear being replaced by AI → solution: position them as experts who validate alerts; (2) lack of data skills → internal training or external partner; (3) silos between IT and maintenance → create a cross-functional project team from day one. Success depends on people as much as technology.
Does this approach work for every industry?
Particularly profitable for: petrochemicals (downtime = millions €/day), food processing (contamination on failure), automotive (just-in-time), energy (critical availability). Less relevant for: small batches, simple low-cost machines, artisanal environments. Rule of thumb: if one hour of downtime costs >2,000€, the investment is probably justified. AESTECHNO runs a free feasibility audit to validate your use case.
Related
The articles below are companion references that complete the predictive-maintenance stack, from radio layer choice to IoT cybersecurity and robust sensor design. To complete your IoT predictive maintenance strategy:
- LoRaWAN, NB-IoT, Sigfox: which network for your sensors? – Pick the right connectivity for your plant (range, cost, autonomy)
- Which IoT database for your sensors? – Store and exploit machine time-series (InfluxDB, TimescaleDB)
- Industrial IoT cybersecurity: threats and solutions – Protect your sensors and production data against attacks
- Electronic board design: method & industrialisation – How we design certified, robust industrial sensors
Why choose AESTECHNO?
- 10+ years of expertise in electronic design
- 100% success rate on CE/FCC certifications, across dozens of campaigns run over more than 10 years of practice
- Turnkey POC: sensors + gateway + dashboard
- French design firm based in Montpellier
Article written by Hugues Orgitello, electronic design engineer and founder of AESTECHNO. LinkedIn profile.
Validate your predictive maintenance ROI before investing
AESTECHNO designs your IoT sensors and calculates your real ROI with a methodology proven on industrial projects:
- Free ROI audit: personalised calculation on your real costs
- 1-machine POC: technical validation in 2 to 3 months
- Custom vibration, temperature, and current sensor design
- Edge and cloud architecture: InfluxDB, Grafana, SMS/email alerts
- CMMS integration: connection to your existing ERP
- Technician and data-analyst team training